
Have you ever wondered if our planet is really heating up? Look at the rising heat and the taller ocean waves – they tell a clear story. Over the last hundred years, our world has been warming bit by bit, and the water along the coastlines has been inching higher.
It might seem like a small change at first, but this slow warming touches every part of our daily lives. Scientists have gathered solid facts that show how our climate is changing. Next, we’ll take a closer look at how everyday temperature increases and rising seas are sparking fresh scientific ideas.
Physical Indicators of Climate Change: Temperature Rise and Sea Level Trends
We’ve been keeping an eye on our planet’s temperature, and it’s clear that things are heating up. Since records began in 1880, we’ve seen a slow but steady rise in average temperatures. Take Ireland, for example, its average temperature has gone up by about 0.9°C over the past 120 years. Even though that might seem like a small change, it tells us that the air around us is warming and our climate is shifting.
Sea levels are showing a similar trend. Scientists have measured rising water levels using coastal tide gauges (instruments that track ocean height) and satellite altimetry (techniques that measure the distance to the sea surface). The water rises because warmer water expands (thermal expansion) and ice is melting. We even see changes in rainfall patterns that back up these findings. All these observations paint a real picture of a changing climate.
- Global average temperature increase since 1880
- CO₂ levels have risen by about 50% compared to pre-industrial times
- 15 of the 20 warmest years have occurred since 1990
- Sea levels have risen around 20 cm since 1900
- There are noticeable shifts in rainfall patterns
Peer-reviewed climate reports back up these numbers using careful, long-term observations. Researchers pull data from networks of weather stations, satellite measurements, and coastal records. These studies highlight how higher greenhouse gas levels are linked to warming temperatures and changing weather. This clear, measurable evidence helps guide science discussions and policy decisions about our future.
Atmospheric Evidence of Climate Change: Growing Greenhouse Gas Concentrations
Greenhouse gas readings show that our air is getting heavier with heat-trapping gases. Since the days before factories and modern industry, the amount of carbon dioxide has shot up by about 50% and is now at a high not seen in 800,000 years. This extra carbon dioxide works like a warm blanket wrapped around our planet.
Historical CO₂ Monitoring
Back in 1958, Charles David Keeling began taking daily measurements of carbon dioxide. Because of his work, we have over 60 years of helpful data. The steady climb in these numbers clearly shows that human activities have been slowly adding more carbon dioxide to the air, gently pushing our climate in a new direction.
Methane and Nitrous Oxide Trends
Methane and nitrous oxide, even though they aren’t as common as carbon dioxide, have also been rising to record levels. These gases are powerful heat-trappers, meaning they hold onto heat much like carbon dioxide. Scientists use a method called radiative forcing (a way to measure how much the gases change the balance of energy on Earth) to figure out just how much warming each gas causes. This approach gives us clear, measurable proof that our growing greenhouse gases are heating up the planet.
Cryosphere Evidence of Climate Change: Ice Core Records and Glacial Retreat
Ice cores are like a frozen diary of Earth’s past. They let us see how the levels of CO₂ (the gas that warms our planet) and temperature changed together over thousands of years. Back in 1985, scientists uncovered ice cores from Antarctica that held climate secrets spanning 150,000 years. They show that Earth’s climate has always had its highs and lows. Today’s CO₂ levels are higher than anything recorded in these layers, which tells us that our atmosphere is not following nature’s old patterns. Imagine peering into a frozen library where every layer tells a story of warming and cooling, it really shows us how today’s heat-trapping gases are different from those in the past.
Today, researchers also track how quickly glaciers shrink and how much ice is lost from the land. Their work goes hand in hand with what we learn from ice cores. Studies show that since the late 1900s, glaciers around the world have been melting at a rate never seen before.
| Ice Core Site | Time Span (years) | Key Finding |
|---|---|---|
| Vostok, Antarctica | 150,000 | CO₂-Temp correlation |
| Law Dome, Antarctica | 2,000 | Pre-industrial vs. modern CO₂ rise |
| Dome C, Antarctica | 800,000 | Record low and high CO₂ levels |
When glaciers melt, it’s not just about shrinking ice; it also makes sea levels rise. The meltwater flows into our oceans, which adds to higher sea levels across the globe. Studies tell us that losing land ice is one of the main reasons sea levels are climbing because it changes how the world’s water is balanced. Every bit of disappearing ice reminds us how crucial it is to keep studying our changing climate and to understand these trends better.
Ocean Evidence of Climate Change: Heat Content and Acidification
Our oceans are soaking up most of the extra heat in our warming world. More than 90% of the extra energy from greenhouse gases ends up here. This huge heat boost not only warms the water but also shows clear signs of global warming.
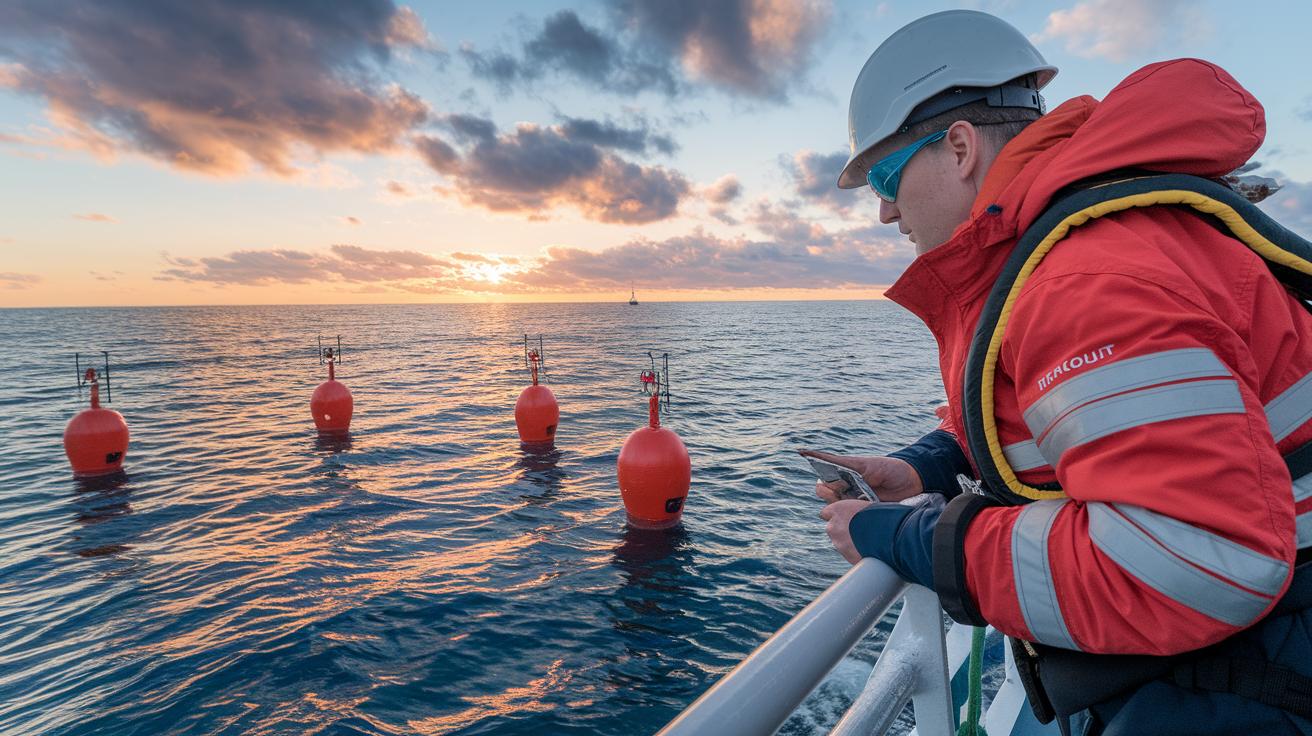
Scientists have been tracking ocean temperatures for many years. They watch how the water gathers heat over time. As the water warms, it expands, which can add more water to our coastlines. Researchers use tools from buoys, ships, and satellites to measure the heat in the ocean’s top layers. Every bit of extra heat in the ocean tells us that our climate is really changing.
Since 1992, experts have noted that the ocean’s pH level has dropped, making the water more acidic. This acidification makes it tougher for coral reefs to build their skeletons. Shellfish also struggle because more acidic water makes it hard for them to form strong shells. Marine heatwaves are happening more often, putting extra stress on ocean life and leading to more coral bleaching. These shifts can disrupt entire food chains in the ocean.
By linking these ocean changes to overall climate trends, scientists see a clear connection between warmer, more acidic waters and other climate signs. The warming ocean affects sea levels through its expanding water and melting ice. All these studies, from heat measurements to tracking pH levels, make a strong case that our oceans are key in understanding and monitoring climate change. Every tiny rise in temperature and drop in pH really counts.
Extreme Weather Evidence of Climate Change: Heatwaves and Precipitation Shifts
Extreme heat events are happening more often because our planet is getting warmer. In 2003, a heatwave in Europe took thousands of lives, showing us how dangerous very high temperatures can be. This tragic event reminds us that heatwaves are growing stronger and more common worldwide.
Rain patterns are changing too. In recent decades, we’ve seen more heavy rainstorms and big downpours. These intense bouts of rain can lead to flooding and put stress on our roads and buildings. Scientists explain that this happens because the climate holds more energy now. They point out that 15 of the 20 hottest years recorded have been since 1990, which supports these changes.
Researchers also use studies and computer models to learn about these weather trends. They use smart techniques to spot unusual weather and understand how different factors (like extra heat or shifting air currents) make storms, heatwaves, and droughts worse. These models show us that extreme weather events will keep increasing in both frequency and intensity. In truth, these scientific findings back up what we observe and help us grasp just how our climate is changing.
Ecosystem Evidence of Climate Change: Biological Response Markers
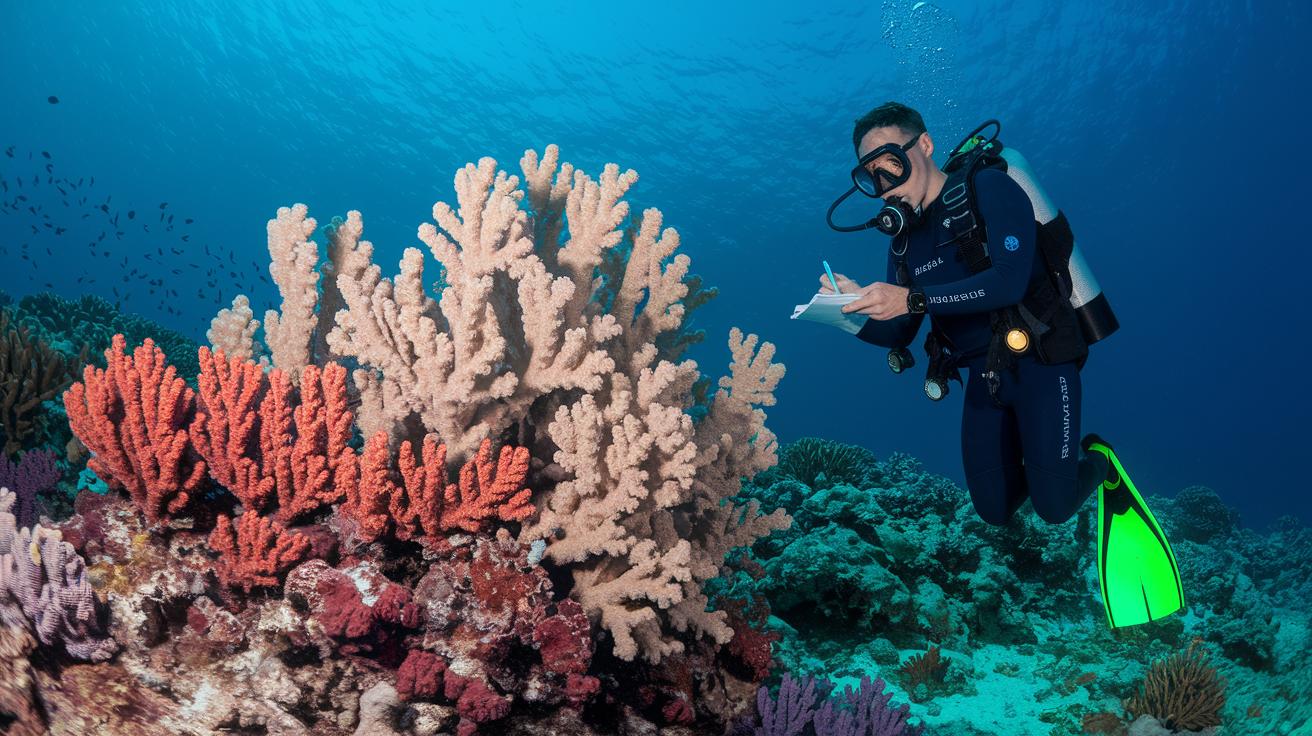
Our oceans are changing before our eyes as the water warms and becomes more acidic. Higher CO₂ levels hurt coral reefs, making them prone to bleaching, a process that strips corals of their color and health. Shellfish, which need a stable mix of water chemicals to build strong shells, are also suffering as conditions shift. Researchers are tracking these changes, and their findings give us clear evidence of how warmer, more acidic waters are stressing marine life.
On land, plants and animals are adjusting too. Many species are moving to cooler areas or higher ground to escape rising temperatures, and some flowers now bloom earlier in the year. Studies suggest that nearly one million species could face extinction if these trends continue, which shows us just how serious these changes are. Altered migration and breeding cycles are upsetting the balance in natural communities, highlighting the real-world impact of our changing climate.
Remote Sensing and Modeling Evidence of Climate Change: Satellites and Climate Simulations
Remote sensing tools have really changed how we watch the Earth's shifts. In 1969, NASA launched the Nimbus III satellite, which gave us our first clear global temperature readings from space. That breakthrough opened the door for ongoing observations. Today, advanced satellite networks keep a close watch on our land, air, and oceans. They capture detailed images that show changes in temperature, cloud cover, and even plant growth over time. This steady stream of data helps us see for ourselves that our planet is gradually warming.
Climate simulation models are another game changer. Back in 1967, scientists built a simple computer model that warned us a 2°C rise might occur if carbon dioxide levels doubled. Since then, those models have grown much more detailed, mixing many climate factors to forecast what might happen next. Organizations like the IPCC use these models by checking their projections against satellite data. Together, simulations and remote sensing tell a consistent story, providing a solid basis for global climate policy and strategy discussions.
Final Words
In the action, we explored rising temperatures, shifting sea levels, and the steady increase in atmospheric greenhouse gases, all of which present clear evidence of climate change. We reviewed physical data from ice cores, ocean heat studies, and extreme weather trends that add up to compelling evidence of climate change.
These carefully recorded metrics inform peer-reviewed reports and remind us to stay curious and engaged as science continues to shape our everyday understanding.
