
Have you ever wondered what our weather might be telling us about tomorrow? New studies show our planet has warmed by almost 1°C since 1850, and that extra heat is a clear sign of a fast-changing climate. Rising CO2 levels (the gas that comes from burning fuels like gasoline) and record temperatures make it seem like our air is shifting more quickly than ever before.
With fresh data challenging what we once thought, it's a good time to think about how small tweaks we make today could shape a better future. In this article, we're breaking down some simple facts that really show why we need to act on climate change right away.
Comprehensive Climate Change Facts Overview
Since 1850, records show our planet has warmed by nearly 1°C (2°F). Up until 1980, the temperature inched up slowly at about 0.07°C per decade, but in the last four decades it has accelerated to roughly 0.2°C per decade. If you’re curious about what climate change really means, a clear explanation is that shifts in our atmosphere – like more greenhouse gases (gases that trap heat near the Earth’s surface) – cause these changes. This gradual warm-up paints a picture of a changing planet and helps scientists dig deeper into the details.
More recent data tells us that carbon dioxide levels have shot up from about 280 parts per million before industrial times to a staggering 421.73 parts per million today. This boost in CO2 strengthens the greenhouse effect, trapping more heat and pushing global temperatures higher. NOAA’s data even shows that 2024 may have been the warmest year recorded, with temperatures topping the 20th-century average by roughly 1.28°C (2.3°F) after 15 months of record-breaking warmth. The latest report from the IPCC warns that the past decade might be the warmest in 125,000 years.
These changes make it clear that our climate is shifting, and they highlight the urgent need to address the causes of warming. The numbers offer important markers for scientific models that shape policy decisions, aiming to cut emissions and safeguard communities. In short, as science gives us sharper insights into our changing climate, these findings remind us that there is no time to waste.
Historical Temperature Trends and Records in Climate Change
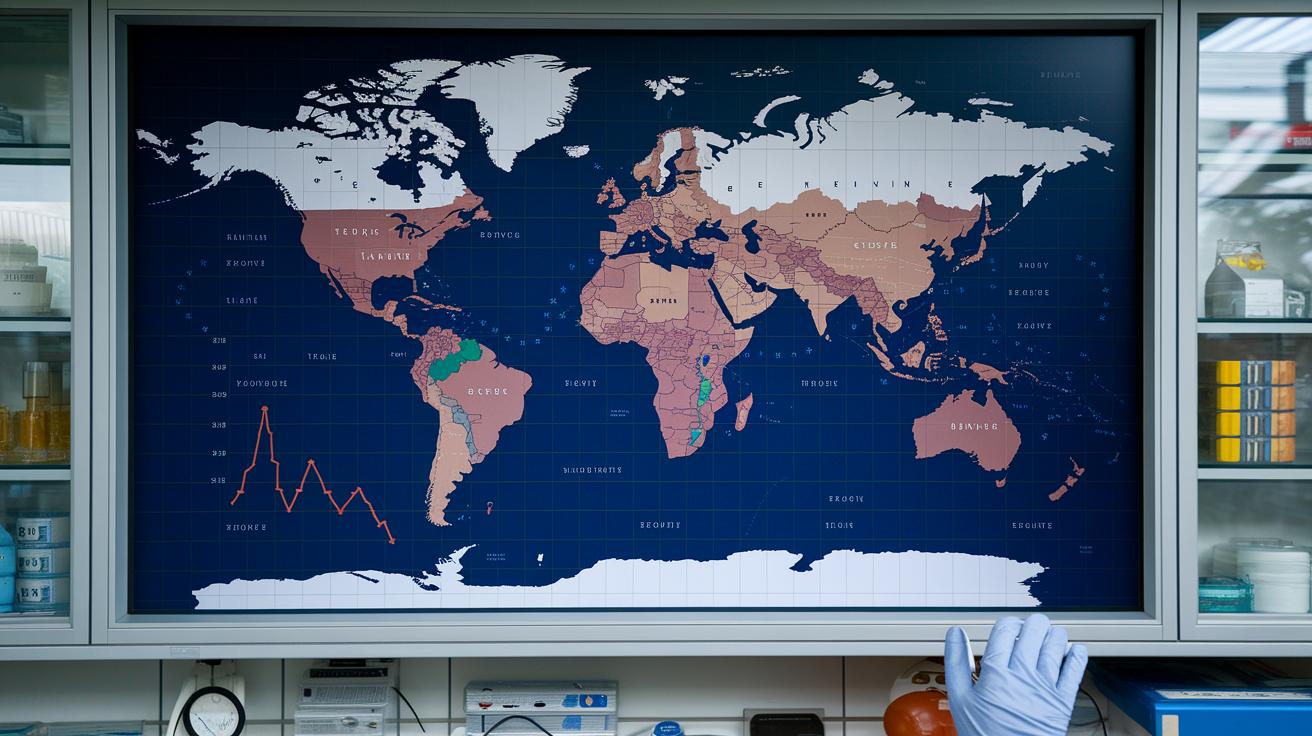
Scientists have kept track of temperatures since about 1850. Back then, records show that our planet warmed slowly, roughly 0.07°C per decade until 1980. But after that, the warming rate quickened to nearly 0.2°C per decade. All together, this gradual change adds up to almost a 1°C increase since the mid-19th century. In fact, the last decade turned out to be the warmest in 125,000 years.
New records give us even more clues about today’s climate. For example, June 2024 became the hottest June ever recorded, and July 22, 2024 marked the warmest day since we began keeping track. These standout moments fit into the bigger picture of long-term temperature changes, showing just how much our climate has shifted.
| Observation | Details |
|---|---|
| 1850 Baseline | Started with instrumental records |
| Before 1980 | Warming at 0.07°C per decade |
| After 1980 | Warming near 0.2°C per decade |
| Total Increase | Almost 1°C rise since the mid-19th century |
| Recent Decade | Warmest in over 125,000 years |
| Record Dates | Hottest month in June 2024 and warmest day on July 22, 2024 |
Each of these findings builds a clearer picture of our changing climate, a gentle reminder that while change happens slowly, it still has a huge impact on our world.
Primary Drivers of Climate Change: Greenhouse Gases and Emissions Data
Greenhouse gases such as CO₂ trap heat that our planet sends out, making our air warmer. For instance, CO₂ levels jumped from 280 parts per million before industrial times to 421.73 parts per million in 2024. This big rise mainly comes from burning fossil fuels and changing how we use land. Activities like mining, drilling, and burning fossil fuels release lots of these gases, and cutting down forests adds about 20% more. These rising numbers show that extra gases are warming our world, and they help us see just how big the changes are.
What does the data tell us? It shows that our actions are changing the mix of gases in our air. The extra greenhouse gases are proof that human behavior is shifting nature’s balance. Check out the table below, it lists key indicators like CO₂ levels, yearly ice loss, and emissions from deforestation. These numbers draw a clear line between past conditions and today’s world, reminding us how burning fossil fuels and altering land use continue to warm our planet.
| Indicator | Pre-Industrial | Current | Unit |
|---|---|---|---|
| CO₂ Concentration | 280 | 421.73 | ppm |
| Annual Ice Mass Loss | 0 | 1.2 trillion | tons/year |
| Deforestation Emissions | 0 | 20 | % of global emissions |
Environmental Impact Data: Sea Level Rise, Ice Melt, and Extreme Weather

Our oceans have quietly absorbed nearly all the extra heat our planet has created, taking in about 90% of it from 1971 to 2010. In 2020 alone, they soaked up 20 sextillion joules of energy (that’s like two Hiroshima bombs’ worth every second!). This huge influx of heat not only warms the water but also causes it to expand, leading to higher sea levels. Essentially, our oceans act as a giant heat sponge, helping to ease the immediate impact of global warming.
At the same time, our planet is losing around 1.2 trillion tons of ice each year. This dramatic ice loss reshapes coastlines and disrupts nearby ecosystems. For instance, mangrove forests store as much carbon as 90,000 cars produce and safeguard communities from floods with benefits worth over US$65 billion each year. When these vital forests decline, both nature and people face serious challenges.
Today, about 3.6 billion people live in areas frequently troubled by droughts, floods, heat waves, and storms. These extreme weather events make everyday life unpredictable and disrupt local economies, forcing communities to adapt quickly. We clearly see the effects of climate change all around us, which reminds us how crucial it is to practice sustainability and unite in action worldwide.
Socioeconomic Environmental Effects and Risks of Climate Change
In many places, hotter days are causing serious health issues. People are facing heat-related sickness and breathing problems from more pollen and polluted air. This daily heat can stress our bodies and lead to more trips to the hospital. In 2019 alone, about 302.4 billion work hours were lost worldwide because of excessive heat, showing us how climate change affects everyday life.
Economic troubles are also a big worry. If global warming continues, experts say the cost could hit 11% to 14% of the world's total economic output by mid-century. But if we can keep warming under 2°C, it might only cost around 4% of the world's output. This big difference shows why it's so important for communities and governments to act fast.
Meanwhile, areas that are already vulnerable face serious risks to their food supplies. Changes in weather and more extreme events make it harder for farmers to grow crops steadily. This not only threatens food security but also puts local economies under pressure, making the future of farming and livelihoods uncertain.
Future Projections, Scientific Consensus, and Policy Approaches on Climate Change

Scientists now agree that what we do really warms up our air, oceans, and land. Recent findings show that just 0.8% of Earth’s surface experiences an average yearly temperature above 29°C. Think about it: only a small patch of our planet gets that hot, but scientists say more areas could see similar heat by the end of this century. New techniques even let us link certain extreme weather events directly to these rising temperatures.
To tackle this warming, countries around the world are coming together with both global treaties and hands-on plans. The Paris Agreement, which 195 nations have signed, creates a worldwide plan to fight climate change, while methods that work with nature might handle roughly one-third of the cooling needed. These new projections build on past research and give us a better idea of how shifting temperatures could change both our environment and the communities we live in.
Final Words
In the action, we reviewed key climate change facts and saw how a 1 °C rise and rapid CO₂ growth point to clear warming trends. We explored how the rise impacts temperatures, sea levels, and even our daily lives, from extreme weather to changes in work hours and food supplies.
We also looked at promising policy approaches and future projections. This analysis leaves us with a keen sense of how science shapes our world, and a positive push to keep learning and discussing these vital subjects.